


This is the ultimate guide to exploratory Data Analysis.
Exploratory data analysis (EDA) is an approach to analyzing and summarizing datasets to identify patterns, trends, and relationships. It is very important in the Data Science Life Cycle because it helps you to get a better understanding of your data, identify any issues or problems with the data, and formulate hypotheses for further analysis.
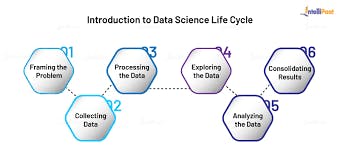
The Data Science Life Cycle is an iterative set of data science steps you take to deliver a project or analysis and maintain any data science product.
Below is a flow chart illustrating the Cycle:
Exploratory Data Analysis is without a doubt one of the most important steps during the process of extracting insights out of data, even before the actual analysis or building of machine learning models begins. For businesses, companies or stakeholders to harness the ultimate power that data provides being the “new oil”, they have to focus on this phase of Exploratory Data Analysis. They, therefore, need to hire data professionals skilled in concepts of exploratory data analysis which include visualization, pattern recognition, creating maps and the like.
This article will give you a guideline on how to get these skills.
What are some of the importance of Exploratory Data Science?
EDA helps us to clean the dataset that we are working with.
It provides a better understanding of the variables in our dataset and the relationships between them.
It helps identify obvious errors and gives a better understanding of patterns present in the data and detects outliers or anomalous events.
EDA helps to select the best algorithms for building a machine learning model.
It answers questions about standard deviations, categorical variables, and confidence intervals within the data.
Once EDA is complete and insights are drawn, its features can then be used for more complex data analysis.
There are four primary types of Exploratory Data Analysis:
Univariate non-graphical. It is the simplest form of data analysis, where the data being analyzed has a single variable. This means that in this case you won’t have to deal with causes or relationships in the data set.
Univariate graphical. In this form, the non-graphical techniques do not present the data analyst with the complete picture of the data as it is in its raw form. Therefore, for comprehensive EDA, you have to implement graphical methods that include:
Stem-and-leaf plots, which show all data values and the shape of the distribution.
Histograms are bar plots in which each bar represents the frequency (count) or proportion (count/total count) of cases for a range of values.
Box plots, which graphically depict the five-number summary of minimum, first quartile, median, third quartile, and maximum.
Multivariate nongraphical: Multivariate data consists of more than one variable. Non-graphic multivariate EDA methods illustrate relationships between 2 or more data variables using statistics or cross-tabulation.
Multivariate graphical: This technique makes use of graphics to show relationships between 2 or more datasets. The most used graphic is a grouped bar plot or bar chart with each group representing one level of one of the variables and each bar within a group representing the levels of the other variable. Some other widely-used multivariate graphics include bar charts, bar plots, heat maps, bubble charts, run charts, multivariate charts, and scatter plots.
Now let’s have a look at the Exploratory Data Analysis Tools:
Python: An interpreted, object-oriented programming language with dynamic semantics. Its high-level, built-in data structures, combined with dynamic typing and dynamic binding, make it very attractive for rapid application development, as well as for use as a scripting or glue language to connect existing components. Python and EDA can be used together to identify missing values in a data set, which is important so you can decide how to handle missing values for machine learning.
R: An open-source programming language and free software environment for statistical computing and graphics supported by the R Foundation for Statistical Computing. The R language is widely used among statisticians in data science in developing statistical observations and data analysis.
Kindly take note that both Python and R are equally good for Exploratory Data Analysis, but each has its unique advantages over the other and it will depend on you to choose the most adequate one for you.
I use Python because of its ease of use and readability and code written in Python is easier to maintain and more robust than that written in R. Python also has very many rich libraries for EDA.
R on the other hand as compared to python is better in both visualization and statistics, one can opt for R for EDA because EDA is mostly performed with visualization and a part of it is focused on statistics.
These are the steps of Exploratory Data Analysis (EDA)
1. Data Collection.
Required data can be collected from various sources through methods like surveys, social media, customer reviews, focus groups or secondary data collection methods like already existing data in books and the like. Without collecting sufficient and relevant data, further activities in Exploratory Data Analysis cannot proceed.
2. Identifying the Variables in the dataset.
This will involve identifying the important variables present in the dataset and which affect the outcome and their possible impact. This is a very crucial step for the final result expected from any data analysis.
3. Cleaning the Dataset.
A dataset may contain null values and irrelevant information which needs to be removed so that data contains only those values that are relevant to the target variable.
- For missing values in a numerical column:
Replace it with a constant value. This can be a good approach when used in discussion with the domain expert for the data we are dealing with.
Replace it with the mean or median. This is a decent approach when the data size is small—but it does add bias.
Replace it with values by using information from other columns.
- Predicting Missing Values Using an Algorithm.
Create a simple regression model, and if there are missing values in the input columns, we must handle those conditions when creating the predictive model. You can manage this by choosing only the features that do not have missing values or taking the rows that do not have missing values in any of the cells.
- Missing Values in a Categorical Column.
You can take care of this by replacing the missing value with a constant value or the most popular category. This is a good approach when the data size is small but it has the disadvantage of adding bias.
4. Identifying the correlated Variables.
This is achieved by visualization in form of a heatmap(correlogram) and finding a correlation between variables helps to know how a particular variable is related to another variable in the dataset. The correlation matrix method gives a clear picture of how different variables correlate and helps in understanding the relationship.
5. Choosing the Right Statistical Methods to employ.
Different statistical tools are used depending on the data, categorical or numerical, the size, the type of variables, and the purpose of analysis. Statistical formulae applied for numerical outputs give fair information, but graphical visuals are more appealing and easier for an observer to interpret. This should help when choosing the right statistical method.
6. Visualizing and Analyzing the Results
After completing the analysis, the findings are to be visualized so that proper interpretation can be made for the sake of analysis. The trends in the spread of data and correlation between variables give good insights for making suitable changes in the data parameters. The results obtained will be appropriate to the data of the particular domain that you will be working on.
Conclusion
Data is very important and it has to be analyzed to gain useful insights that will help in making data-informed decisions, which would otherwise not be possible while the data is still in its raw form. Exploratory Data Analysis goes deep into the data and gives us results that can be accurate and which are used to make important decisions.
Overall, the goal of Exploratory Data Analysis is to gain a deep understanding of your data and to identify patterns that you can investigate further by so doing you can identify potential problems or biases, and develop hypotheses about what might be the cause of these patterns.
This article gave a detailed guide on exploratory data analysis, its importance, the tools that are used and the steps taken while conducting it.